Case Study
A data visualization tool with safety at its heart
Making sense of risks and process safety management through data and productization of knowledge. If that does not get you going, we even whipped up some gameplay in Unity gaming engine!
Client
Simply put, Risk Alive Analytics has the world's largest repository of risk data. Over the years, the company has gathered data on various equipment, processes, and safety events, across industries, including oil and gas, manufacturing, etc. This allows them to consult on process safety management issues, predict hazardous events, repair schedules, and save lives and resources.
Low risk, high gain!
Risk and process safety management are essential to the industry at large. Manufacturers, processing plants and work sites across industries, including oil and gas, utilities, construction, etc. have had to deal with accidents and hazards for as long as they have existed.
To put it in perspective, in 2020, more than 250,000 workplace-related accidents/events were accepted by Workers' Compensation Boards across Canada¹. These incidents and/or occupation-related diseases have resulted in as many as 921 fatalities.
According to some estimates, while fire and explosion account for only 3 percent of workplace injuries, they have the highest casualty rates among workplace incidents².
Process Hazard Analysis (PHA), as the name suggests, refers to a series of studies conducted in workplaces to identify potential hazards and incidents. Hazard and Operability study (HAZOP) is one of the many methods to conduct a PHA.
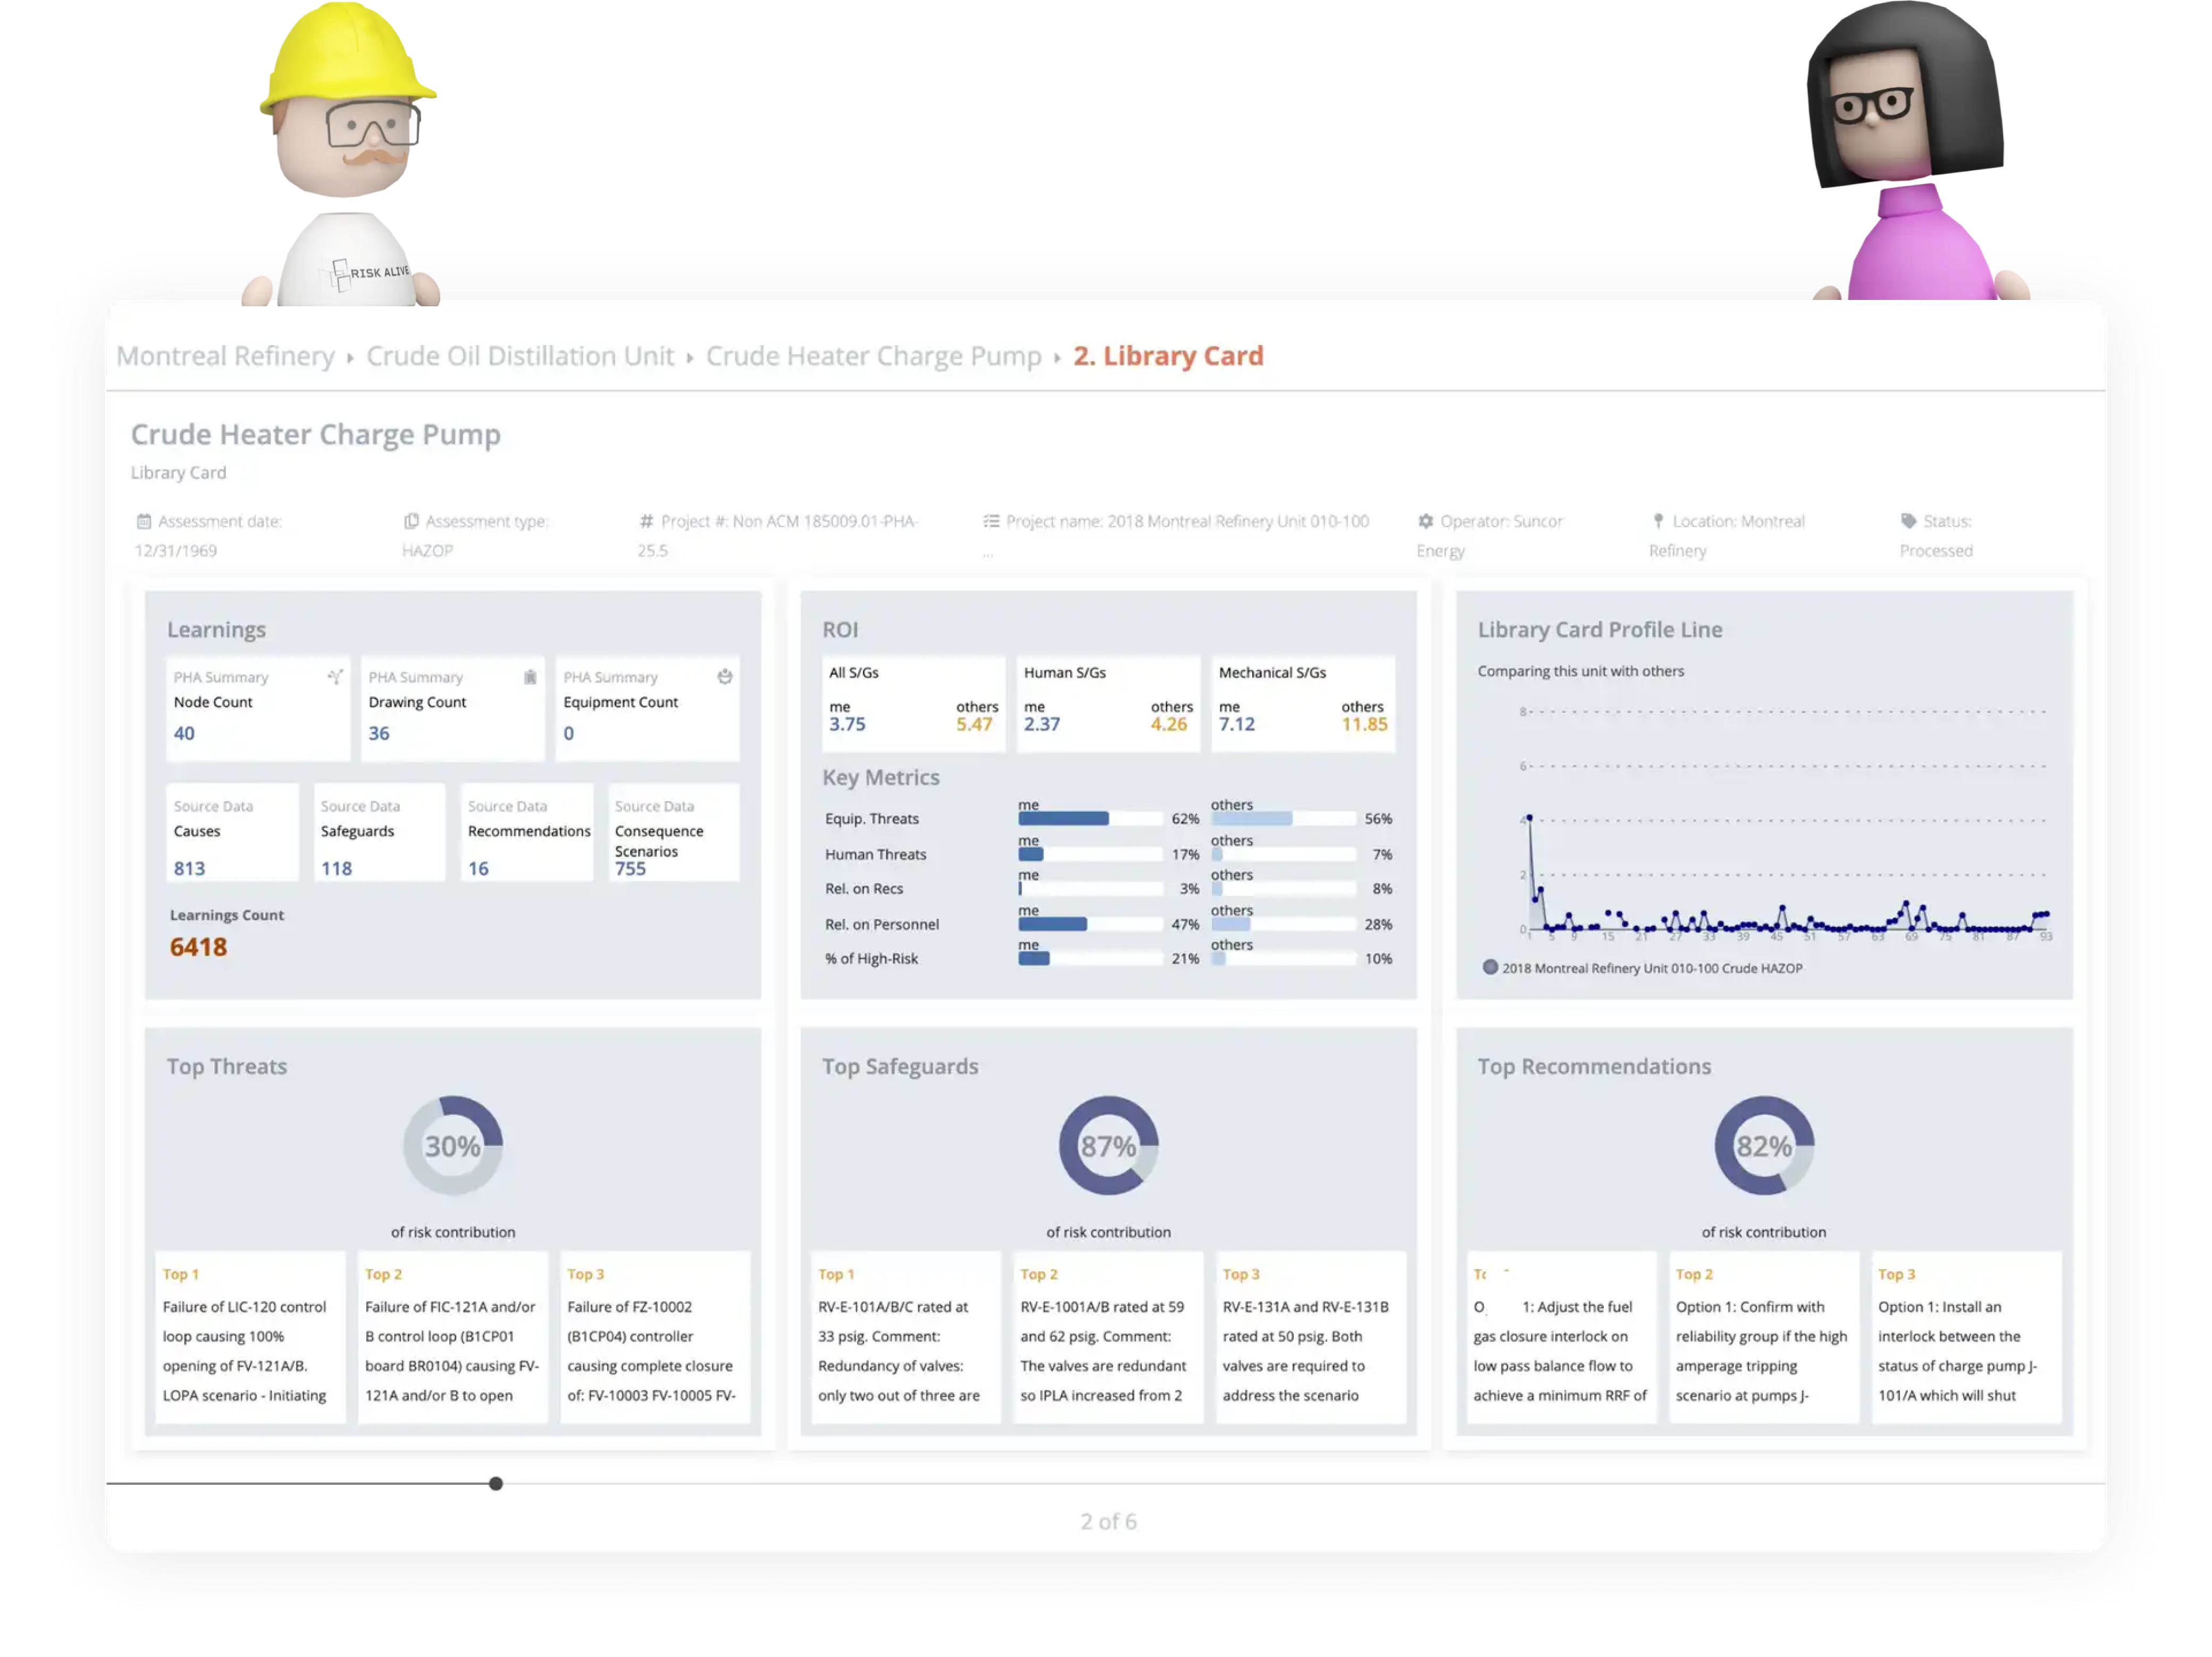
Risk Alive has millions of PHA/HAZOP learnings in their repository and provides its clients/companies access to accurately predict potential hazards based on this information.
The Risk Alive Library productized these thorough learnings and studies, conducted over the years, allowing companies to make informed decisions about risk and process safety management.
How to productize process safety management knowledge?
Risk Alive Analytics has more PHA/HAZOP learnings than anyone else, with data spanning sectors like oil and gas, petrochemicals, mining, food and beverage, etc.
In most cases, any regulatory-compliant risk assessment effort on the part of companies tends to look at existing maintenance and other data, and day-to-day operations to pinpoint potential hazards and risks.
But what if companies had the benefit of a massive repository of data from others in the same industry, who are using similar equipment and do the same kind of work?
Risk Alive facilitates exactly that, with predictive analytics, including trends and averages, hardware wear and tear, optimum maintenance efforts, among other things.
However, Risk Alive wanted to productize this knowledge and the massive repository of learnings, elevating their profile from being just a service provider.
Given that safety manuals and data are not exactly bestselling page-turners (amine surge tanks, anyone?), easy-to-use data visualization and creative innovation technology had to be deployed.
Data visualization & innovation technology
A web-based platform that could simplify complex data, encourage client usage and user interest, implement dynamic user experience depending on the user profile (engineer, plant manager, process engineer, etc.). And if the ideal solution can speak to the administration and jargon-spewing on-floor engineers alike, that would be a cherry on top.
Unity gaming engine & co.
React allows for solutions to be responsive, which means they can be run on different screen sizes and platforms without having to nurture the code and the development process.
From the touchscreen-enabled hardware that connected to the existing fleet of lathes and mills, to the management’s mobile screen, the stack would allow for real-time monitoring in the actual sense of the time.
.png?width=99&height=86&name=download%20(1).png)

How to combine technology with data visualization & safety
The Risk Alive project commanded a deep dive into the world of risk assessment and process safety management. After all, amine surge tanks, chemical compositions, hardware wear and tear, are not everyone's expertise.
The deep dive was also about understanding what the most ideal scenario/method would be to present data and keep it interesting at the same time.
The next step was to give Risk Alive's clients a teaser into the kind of in-depth and detailed information they are dealing with.
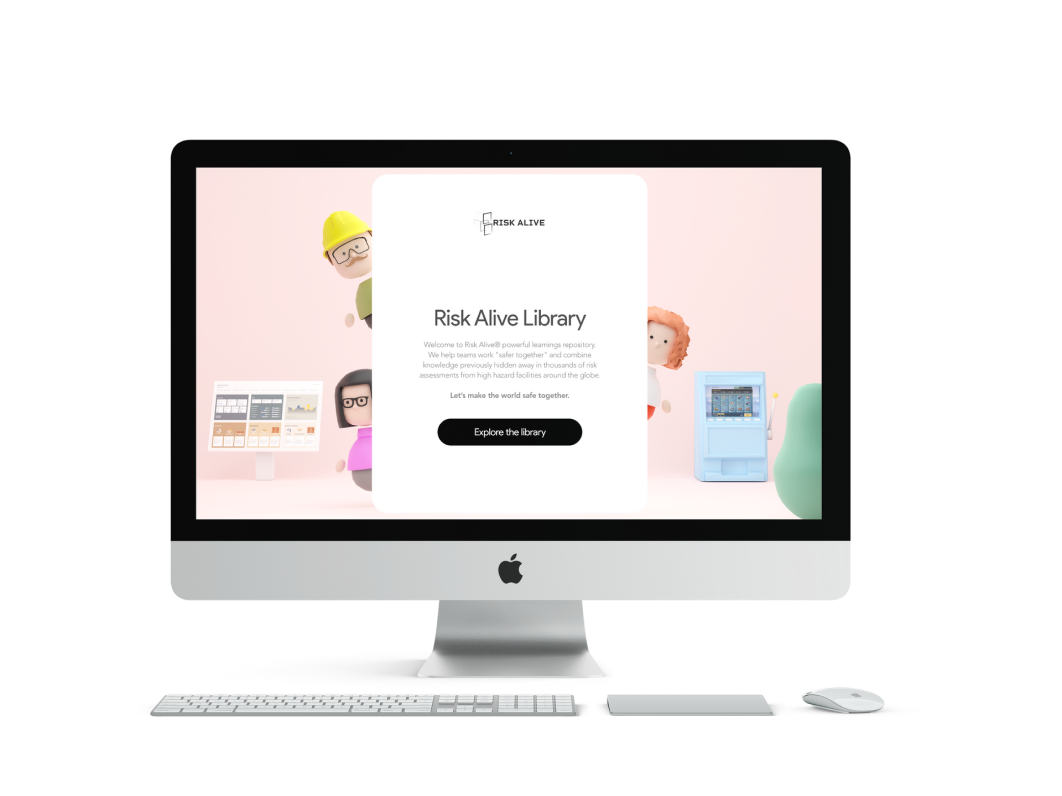
A slot machine game was created. The user, if they got all the answers right about specific unit safeguards, would be scored on the number of attempts. The game not only ensures that it makes the stakeholders think about the safeguards in their respective units, but at the same time also creates a playful competitive spirit.
It shows they are gambling with risks if they don't get it right.
Having given the client (or a potential client) a taste of how Risk Alive focuses on simplifying information about safeguards, the next step was to design a product platform that would help users get specific information and data on hardware, processes, and safeguards.
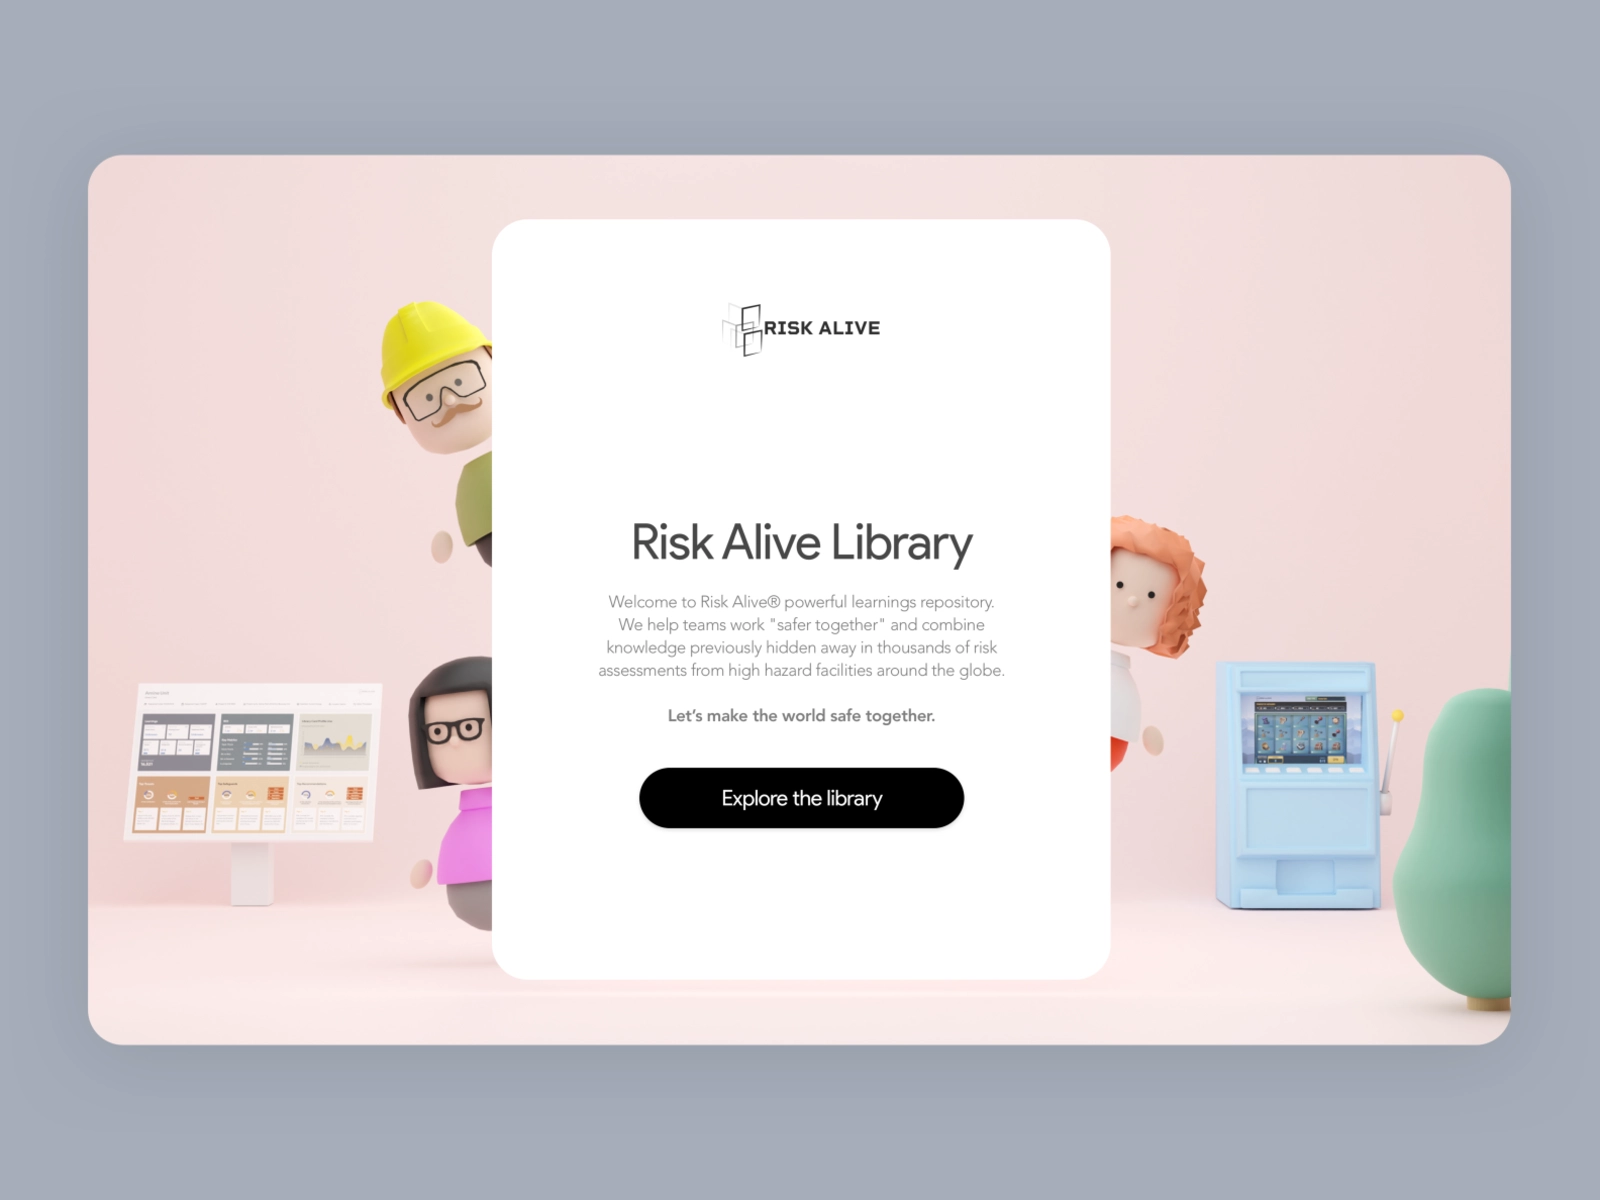
After considering various user interfaces, an online representation of a library was finalized on. Not just any library would have done though. It had to be beautiful and inviting.
Eventually Stuttgart City Library made the cut. The nine-floor cube monolith is among the world's most photographed structures. The symmetry on the outside is matched by an inverted pyramid shape on the inside with flowing stairways taking you further on your journey of knowledge.
Unity gaming engine was used to create an online twin of the Stuttgart library, with multiple user avatars in quest of knowledge.
Books and shelves in the library would be dynamic and change depending on the user avatars.
What you see is what you get
Given the integration of gameplay and characters, it was important that the platform did not look or feel gimmicky.
Gameplay was to only initiate some friendly competitive spirit within the client organization, while also ensuring knowledge sharing and process safety management.
Launchcode developers also had to pay attention to the data visualization aspect of the project. Simplifying was key to platform productization, but oversimplification could potentially alienate the more knowledgeable users of the platform.
There was a fine line between making the platform user-friendly for a wider demographic and making it obsolete for advanced users.
The middle path eventually was to create a Stuttgart City Library-inspired online setup that would interest a wider demographic, and the knowledge gained at the end of a session was simplified enough for all.
Data visualization made easy
The multiple sprints during the various phases of development ensured that some of the biggest pains and questions were answered.
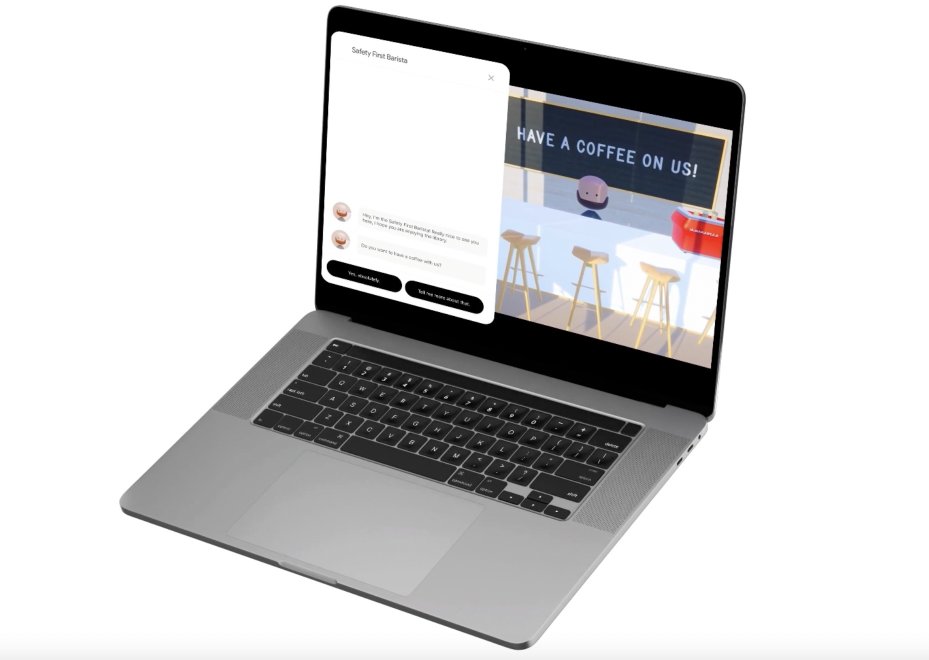
From a marketing perspective for Risk Alive, the slots machine game gave a nice little teaser to current and prospective clients about potential hazards and maintenance events that could arise from their respective plants.
The product - library - that emerged out of the development plan gave Risk Alive an edge and built a momentum off of the slots game.
It had multiple user profiles and characters, various data visualization options, and a compelling and intuitive user interface.
The library had impressionist traits, like simpler graphics, rather than the realism of Stuttgart library's grandeur, baked in to ensure speed and faster loading times. It gave a very playful character to the platform, something that was appreciated.
Clients love us!
An intense run of testing was held, with data from a small group of companies first released onto the platform, before the entire repository was added.
With increased usage of and additions to the database, the library grew in relevancy and credibility.
The solution was well-received by all stakeholders, and the library empowered employees to minimize risk at their facilities while also ensuring a little bit of healthy competition through gameplay.
'Fun' and 'engaging' are some of the adjectives being used for the experience that facilitates learning despite the complexities of data and information at hand.
Anticipation of events and risks has increased manifold among clients of Risk Alive, with sharing of data from the repository allowing decision-making to be data-backed.
Citations
1“National Work Injury, Disease and Fatality Statistics (NWISP) - Year At A Glance”. Association of Workers' Compensation Boards of Canada. Accessed 24 May 2022.
2Foulis, Maia. “The five most common types of workplace injuries”. The Safety Mag, 15 November 2021. Accessed 1 June 2022.
More accomplished visions
Scheduling, optimization and real-time visualization
Simplifying IT asset management, boosting efficiency
